
Your database restores in 45 minutes. The data is all there. But users still can’t access the app because the IAM roles, security groups, and routing tables weren’t restored. The Recovery Point Objective (RPO) was met. The Recovery Time Objective (RTO) wasn’t. Understanding the difference between RTO and RPO in disaster recovery – and what it actually takes to meet both – is where a Disaster Recovery Plan that holds under pressure begins.
TL;DR
- RTO measures how long you can be down; RPO measures how much data you can afford to lose. They measure different things and require different investments.
- Reducing RPO (backup frequency) is the easier half. Reducing RTO requires recovering your entire environment, not just data.
- Most teams set RTO and RPO during a Business Impact Analysis, but skip the infrastructure layer that makes RTO achievable in practice.
- In 2026, AI-driven infrastructure changes mean environments drift faster, and so does the gap between documented RTO and actual recovery time.
- ControlMonkey closes that gap by restoring infrastructure configuration alongside data, so your RTO target holds when it matters.
What Are RTO and RPO in Disaster Recovery?
Recovery Time Objective (RTO) is the maximum acceptable time between a failure and full system restoration. It measures forward from the failure event. If your RTO is four hours, your environment must be fully operational within four hours of the outage: data restored, services running, users able to transact.
Recovery Point Objective (RPO) is the maximum acceptable amount of data loss, expressed as time. It measures backward from the failure event to the last usable backup. An RPO of 15 minutes means you cannot lose more than 15 minutes of data changes when a failure occurs.
They are not the same metric. They are not interchangeable. Each requires a different investment, owned by different teams. Failing one does not mean failing the other.
A concrete example: a SaaS finance platform sets a 4-hour RTO and a 15-minute RPO. The 15-minute RPO means their backup runs every 15 minutes. That is a storage and replication problem. The 4-hour RTO means they need pre-provisioned compute, automated failover, and a full environment – including IAM, networking, and routing – ready to restore within four hours.
That is an infrastructure problem. Both targets live in the cloud disaster recovery plan, but they require completely separate engineering decisions.
Both metrics are set during a Business Impact Analysis and documented in the DR plan. The BIA connects the financial cost of downtime and data loss to the technical investment required to avoid it.
How RTO and RPO Are Measured
RTO and RPO are both expressed in time, but they point in opposite directions from the failure event. RTO points forward: it is the recovery window. RPO points backward: it is the data-loss window.
Your Backup Frequency defines RPO. A system backed up every hour has a one-hour RPO, regardless of how fast you restore. Your Recovery Architecture defines RTO. A system with a fully automated recovery stack has a shorter RTO than a system rebuilt manually from runbooks.
The diagram below shows how both metrics sit on the same timeline but capture different dimensions of the failure event. Note the two recovery paths from the failure point: a data-only restore leaves the infrastructure configuration gap open, while restoring configuration alongside data – via ControlMonkey – produces a full recovery.
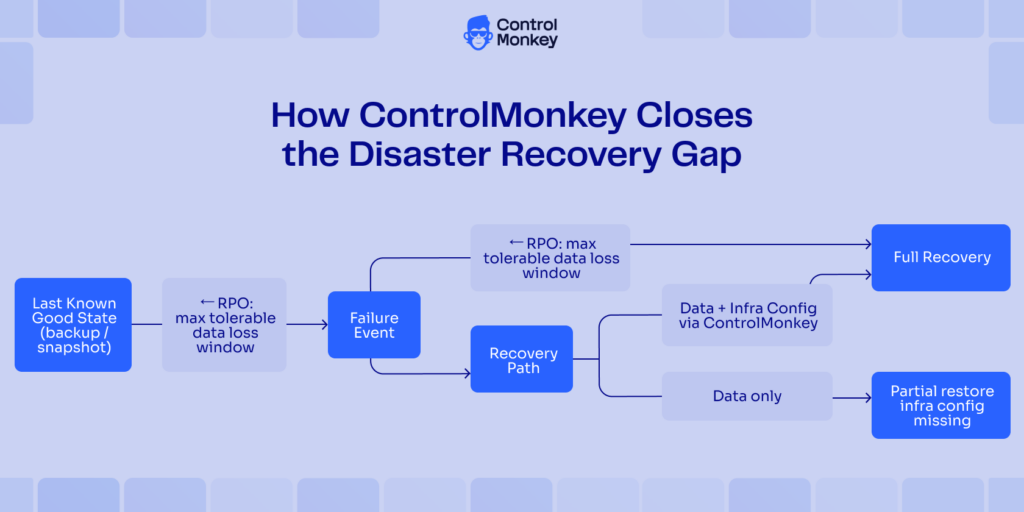
RPO looks back to the last clean state; RTO looks forward to full recovery. When only data is restored, the infrastructure configuration gap keeps systems down and the RTO clock keeps running.
RTO vs RPO in Disaster Recovery – Key Differences That Actually Matter
RTO and RPO look similar on paper. Both are time-based. Both live in the DR plan. Both come out of a BIA. But they drive completely different technical decisions and different cost curves.
| RTO | RPO | |
|---|---|---|
| Measures | Time to restore operations | Amount of Data Loss tolerable |
| Direction | Forward from the failure | Backward from the failure |
| Primary cost driver | Infra redundancy, recovery automation | Backup frequency, replication bandwidth |
| Typical owner | Platform / infra engineering | Storage / backup administration |
| Key risk if missed | SLA breach, revenue loss, operational shutdown | Data loss, compliance violation, re-entry cost |
| Gets harder with | More complex infrastructure, AI-driven drift | More frequent data changes, real-time transactions |
The cost curves run in opposite directions. Reducing RPO means running backups more often, adding replication capacity, increasing storage. Not cheap. But calculable. Reducing RTO means pre-provisioning infrastructure, automating failover, and having the full environment state ready to restore to. Not just data backups. The compute, networking, IAM, and service configuration that makes the restored data accessible.
Here is where the gap shows up in practice. A mobile-app company sets a 2-hour RTO target. After an outage, their database restores in 45 minutes. Fast. But their API gateway configuration, security groups, and service roles are gone, rebuilt manually from memory and Slack messages. That manual rebuild takes 6 hours. The team met the RPO. They missed the RTO by four hours. Users couldn’t buy for most of the morning.
The ownership split makes this worse. The backup team owns RPO and does their job well. The platform team owns RTO, but does not own a full infrastructure state backup. There is no owner for the configuration layer, so it falls through the gap.
See your real RTO before an incident does
Most teams discover their configuration layer has no recovery owner only after an outage – when the database is back in 45 minutes and the rebuild takes six hours.
How to Set RTO and RPO in Your Disaster Recovery Plan
Setting RTO and RPO starts with a Business Impact Analysis. The BIA ties recovery targets to actual business cost, so you are not guessing at what “acceptable” means. Here is how to run it and translate the output into targets your infrastructure team can work toward.
Step 1: Run a Business Impact Analysis
A BIA identifies every system, application, and data set your business depends on. For each one, quantify the cost of downtime per hour: lost revenue, SLA penalties, compliance exposure, and operational disruption. Also quantify the cost of data loss, including recreate cost and regulatory risk.
For a cloud-based order management system, start with lost orders per hour times average order value. Then add the labor cost to manually re-enter transactions if backups run hourly. That number drives your RPO target. The hourly Downtime cost drives your RTO. Per NIST SP 800-34, the BIA is the foundation of any meaningful contingency planning process, the step that produces the RTO, RPO, and Maximum Tolerable Downtime values your team actually works from.
Step 2: Tier your systems by business criticality
Not every system needs the same RTO or RPO. Use the BIA output to group systems into tiers. Workload Tiering by business impact: Tier 1 systems are mission-critical, with RTO targets under one hour. Tier 2 systems are business-important, with RTOs under four hours. Tier 3 systems are supporting infrastructure, where RTOs of 24 hours may be acceptable.
RPO follows the same tiers but is set independently. A fintech company’s Tier 1 might include the payments API and authentication service. A 1-hour RTO on the payments API might pair with a 5-minute RPO, because losing more than 5 minutes of transaction data creates reconciliation work that costs more than the backup infrastructure. The reporting dashboard, a Tier 2 system, might tolerate a 1-hour RPO just fine.
Step 3: Define RTO and RPO targets per tier
Set targets from BIA cost data. Not intuition. For each tier, your RTO must be less than the Maximum Tolerable Downtime with a buffer for recovery complications. MTD is the hard ceiling: the absolute limit before disruption becomes catastrophic.
If the BIA shows a payment service loses $30,000 per hour, and the business can absorb $90,000 before facing existential risk, the MTD is 3 hours. Your RTO must be 2 hours or less to leave a buffer. Document both in the DR plan. These are the targets your team is accountable for.
Step 4: Map your recovery architecture against each target
Translate each RTO into an infrastructure requirement. A 1-hour RTO on a Tier 1 system means you need pre-provisioned compute, automated failover, and a tested infrastructure state to restore to. Not a manual rebuild.
This is where most DR plans break down. The RTO target gets set, but the architecture to meet it never gets built. Walk through the actual recovery steps for a Kubernetes-based API service: snapshot restore (15 min), IAM and security group restore (45 min), pod restart (10 min), health-check validation (10 min). That totals 80 minutes. If your RTO is 1 hour, the IAM and security group restore step is the bottleneck. It was never the data.
Infrastructure disaster recovery platforms automate the configuration restore step. ControlMonkey continuously captures your infrastructure state so that Step 4 always has a known-good baseline to restore to, turning a 45-minute manual task into a fast, repeatable one.
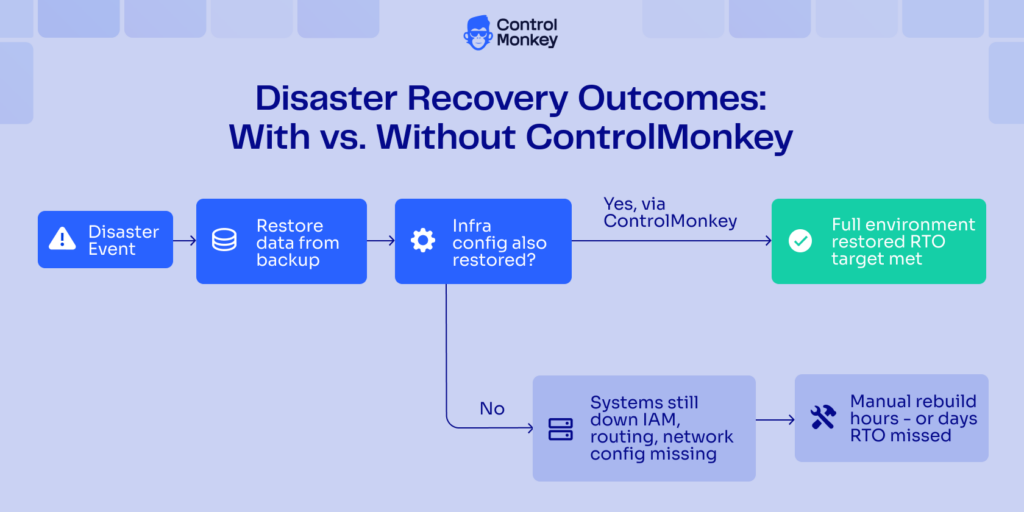
Two paths from a disaster event. Data-only restore leaves IAM, routing, and network config missing, and systems stay down. Restoring infrastructure configuration via ControlMonkey alongside data produces a full recovery within your RTO window.
Step 5: Test, measure, and revise
A documented RTO is not a real RTO until tested under realistic conditions. Run tabletop exercises at minimum annually. For Tier 1 systems, run a full failover test quarterly: restore from the most recent snapshot to a staging environment, timed end-to-end, with step-by-step breakdowns logged.
When the test reveals a gap, and it will, revise the architecture before revising the target. The number on paper is not the goal. Actual recovery is.
Why Infrastructure Configuration Breaks RTO in Practice
Most teams back up their data well. They run scheduled snapshots, replicate across regions, and can verify their RPO within minutes. That part works. What breaks is the layer above the data: the IAM roles, security groups, routing tables, VPC settings, and service account configurations that make the restored data accessible and the application functional.
When an outage hits, the data restores in 30 minutes. Then engineers spend 3 to 6 hours manually re-creating the configuration layer from memory, Slack messages, and runbooks that haven’t been updated since last quarter. That’s the real RTO bottleneck. Not restore speed. Configuration drift.
Infrastructure Configuration drift, the gradual unintentional divergence of a live environment from its intended baseline, is a well-documented cause of extended downtime and failed recovery tests, according to IBM. In cloud environments, drift happens constantly. Console changes, script runs, automated tooling adjustments, and team-by-team variations all push the live environment further from what the DR plan describes. By the time a disaster hits, “restore from last known good” is harder to define than it should be.
A concrete example: a healthcare SaaS company restores patient records from backup in under an hour. RPO met. But the application’s service accounts are configured incorrectly during recovery, blocking access to the restored data. The engineering team works through the configuration layer manually, resource by resource. They miss their 4-hour RTO by five hours. A compliance audit flags the extended outage. The RPO number in the DR plan was never the problem.
“We’ll rebuild from IaC” is not a recovery plan. Even organizations with full Infrastructure as Code coverage cannot assume the IaC repo matches the live environment. IaC is a governance tool, not a recovery mechanism. Drift between the repo and production is the norm. A Terraform plan run post-outage will surface the discrepancies. But identifying them manually, resolving conflicts, and applying changes in the right order adds time your RTO cannot absorb.
ControlMonkey prevents that gap by continuously capturing the actual state of Cloud Infrastructure configuration, not just what the IaC repo says. When recovery starts, the baseline is current, not a best-guess reconstruction from last month’s repo state.
RTO and RPO in the AI Era: What Changes in 2026
The assumptions behind RTO and RPO were built for a more stable world. Infrastructure changed slowly. Outages were rare. Recovery tests reflected realistic failure scenarios.
Those assumptions are breaking down in 2026.
AI agents now make real changes in production. They open pull requests, run deploys, adjust permissions, and touch IAM. When non-deterministic systems hold that level of access, infrastructure state drifts faster and less predictably than any human-operated environment. Analysts estimate that more than half of enterprise teams already run AI agents in some form of production capacity. That number is growing fast.
This has two concrete effects on RTO and RPO planning. First, the gap between your documented infrastructure state and your actual infrastructure state grows faster. “Restore from last known good” becomes harder to define when the environment changes multiple times a day across multiple autonomous processes. Second, the blast radius of failures is larger. A misconfigured AI agent can touch dozens of services simultaneously. The recovery scope is wider than a human-caused incident.
Practical implication: RTO targets set three or four years ago may have been achievable for a stable, human-operated environment. In 2026, with AI-driven infrastructure change as a constant, those same targets need re-validation. The architecture to meet them needs continuous configuration capture, not just periodic backups.
Business Continuity planning was built for rare disasters. Today, the question is not whether something will break. It is whether your recovery architecture was designed for the environment you actually run.
Closing the Recovery Gap: From RTO on Paper to RTO That Holds
RTO and RPO are not the same metric. They measure different failure dimensions, require different investments, and are owned by different teams. Understanding that difference is step one.
Step two is building a recovery stack that meets both. That means treating infrastructure configuration recovery as a first-class concern, not an afterthought.
Most teams have the data side of Disaster Recovery covered. Backups run. RPO is tested. Where RTO breaks down is the configuration layer: the IAM, networking, and service settings are rebuilt manually, under pressure, in the middle of an outage.
The teams closing that gap are the ones who know what their environment actually looks like before something breaks. They have a current, captured state to recover to. They run tests that include the configuration restore step. And when something breaks in a 2026 environment running AI-driven infrastructure changes, they do not have to guess at what “last known good” means.
Handling RTO/RPO in disaster recovery well is not just a matter of setting the right numbers in a plan. It has the infrastructure in place to meet them. ControlMonkey makes that real: continuous configuration capture, reliable restore targets, and a recovery process that reflects how your environment actually runs.

A 30-min meeting will save your team 1000s of hours
A 30-min meeting will save your team 1000s of hours
Author